High Level Performance Report


We were tasked with creating a high-level performance report to track the sales and business efficiency of Amazon and other sales channels. The report needed to be automatically updated, with a link to the newly generated report sent to the C-level and VC-level executives within the company.
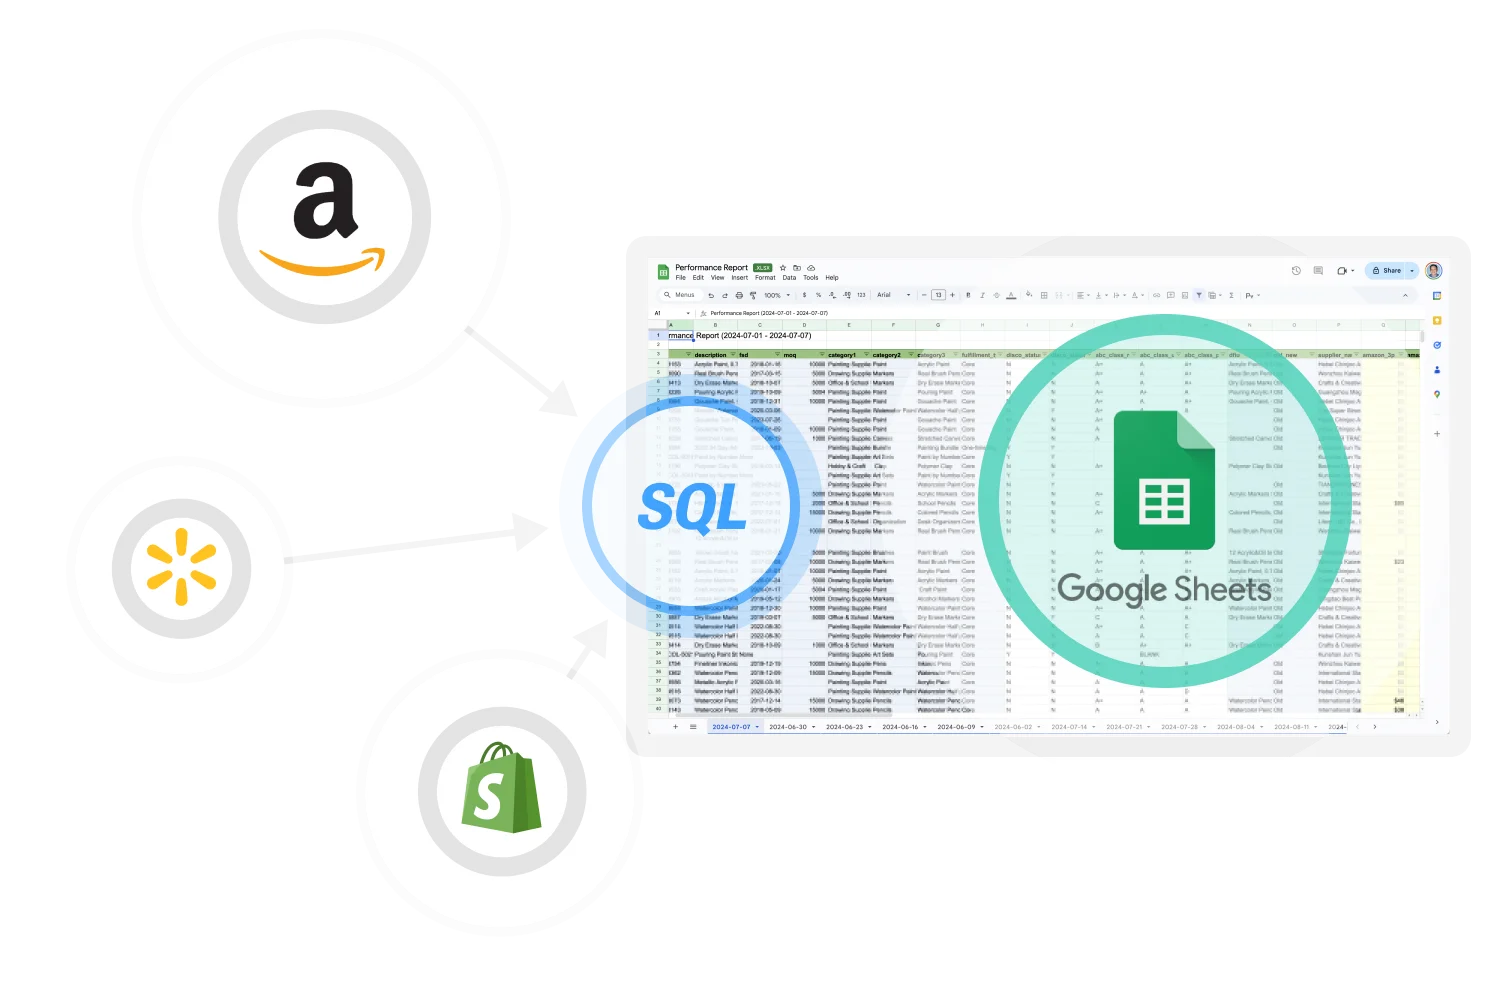
The report is SKU-based and weekly-based, meaning it is generated at the beginning of the week and automatically compiled. Two versions of the report were implemented – one in Tableau and another in Google Spreadsheet, each with different levels of detail and customization.
The report contained the following data and fields (briefly grouped):
The report data is generated through a single large SQL query in the Data Warehouse and cached in a separate table for fast report retrieval later on. A Python script that triggers the SQL query and compiles the report runs automatically once a week within a reliable data pipeline management system — Airflow.
The Google Spreadsheet implementation is the primary solution. Once a week, a Python script creates a new sheet in the spreadsheet and uploads the report. The columns are automatically formatted and color-coded. After the report is generated, a link to the created sheet is automatically sent to the C-level and VC-level executives.
The implementation in Tableau is more advanced, with additional filters:
Ready to take your e-commerce to the next level? Let’s discuss how we can make it happen together.